Ever since I decided to integrate Firebase into a production app about a year and a half ago, I've been completely intrigued by the real-time web; I believe it can be applied to just about any industry for any purpose with great benefit.
I'm now turning my needs for an advanced reporting tool over to Keen.io, whom I've been following for just about a year now. There is some great synergy between Firebase and Keen.io going on, and I thought that Firebase could solve a problem that Keen.io has of dashboards & charts not being real-time. There are so many potential use-cases out there that could really use a real-time reporting solution as a great asset.
I contacted Keen.io to get a general run-down of their services, as I've just been a passively following their service up until now. Justin at Keen.io was very helpful, and provided me with some direction of integrating Firebase to some extent, which could add some real-time capabilities to their data. Due to my previous history with Firebase this was right up my alley, and I was excited to setup an example use-case of this setup. Hope this post helps out some others as well!
Flow it out
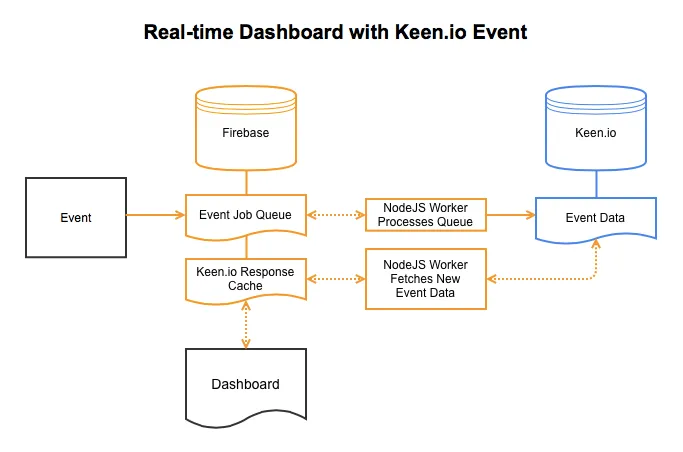
I like to chart out complex ideas like this before I code anything, so I know exactly what's involved with something like this. Here's my gliffy:
Keen.io is all about event data. They have a really good article about how to think about event data, and I'd also recommend to check out their data modeling guide on how to structure your event data. For this article, I'm going to be working with Purchase events, which refers to any order placed anywhere.
To explain what's happening in this flowchart, Firebase is being used as a sort of proxy to pass data to and from Keen.io. When the event happens, a record of the event data will be created in a job queue. We'll have a backend NodeJS worker waiting for queue items to process, and the worker will in turn dump the event data directly into Keen.io. We'll also have another NodeJS worker running, which will keep a steady prime of data loaded from Keen.io back into Firebase, to be used as a data cache; this way, our client will deal directly with Firebase, and never call Keen.io directly. This will also aid in loading our dashboard instantly, as we won't have to wait for a response request from Keen.io to complete in order to load the initial data history to render our initial charts & graphs.
It is relevant to note that Keen.io could have a delay of 10 seconds ore more between the time the event data is input until the time data shows in the data analysis. I've thought of ways to circumvent this, but it's just the nature of the tool, and really is a small price to pay for getting all of the advanced computational analysis going on in the background. If for some reason you have higher demands, and do need specific data available instantly in your real-time dashboard, you can always store the event or object data directly in Firebase, but you will lose the type of analysis and reporting possibilities available in a service like Keen.io. In this case it may make sense to store simple things like count items (number of purchases) directly in Firebase, but not necessarily anything with advanced reporting & segmentation needed, such as product types ordered on what purchases over time. That's the type of data for which Keen.io was built.
Store Event Data in a Firebase Job Queue
Our first step is to capture our event data. Instead of calling Keen.io directly, we're going to first create a job queue in Firebase containing the event data, and push items there. I first started off with the work queue Firebase created to accomplish this; however, it was very basic and didn't handle error fallbacks or data integrity on server failure. I forked this into the advanced work queue, which has the same general flow, but adds in an additional layer of redundancy, along with error callbacks & timestamps.
Let's create a new folder to make a home for our code:
mkdir firebase-keen
cd firebase-keen
Once we are in our folder, we'll install the firebase and keen.io npm's:
npm install firebase keen.ioWe'll also download the firebase-work-queue-advanced code from github to our folder:
curl -O https://raw.githubusercontent.com/markoshust/firebase-work-queue-advanced/master/workqueue-advanced.jsLet's first create some event records. Since we don't have any events right now, and we're a bit short on time to create a ton of them, let's use a worker to create a lot of events in Keen.io. I created this script to generate somewhat random data, so we don't get a ton of records with the same information.
var Firebase = require('firebase'),
    workItems = new Firebase('https://YOUR-INSTANCE.firebaseio.com/keen/event-job-queue'),
    firstNames = [
        ['Brielle', 'Darla', 'Fran', 'Gwen', 'Juliann', 'Lily', 'Maria', 'Piper', 'Susan', 'Tammy'],
        ['Ben', 'George', 'John', 'Mark', 'Mike', 'Nate', 'Paul', 'Roman', 'Stewart', 'Toby', 'Zach']
    ],
    lastNames = ['Crocker', 'Fisher', 'Fitzgerald', 'Johnson', 'Georgeson', 'Parker', 'Robertson', 'Thompson', 'Walker', 'Woo'],
    createEvent = function() {
        var randGender = Math.round(Math.random()),
            randFirstName = Math.floor(Math.random() * 10),
            randLastName = Math.floor(Math.random() * 10),
            randAge = Math.floor((Math.random() * 82) + 18),
            randCost = parseFloat((Math.random() * 300).toFixed(2)),
            customerName = firstNames[randGender][randFirstName] + ' ' + lastNames[randLastName],
            customerGender = randGender == 0 ? 'Female' : 'Male';

        workItems.push({
            eventName: 'Purchases',
            customer: {
                name: customerName,
                age: randAge,
                gender: customerGender
            },
            cost: randCost,
            createdAt: Firebase.ServerValue.TIMESTAMP
        });
    };

(function loop() {
    setTimeout(function() {
        createEvent();
        loop();
    }, Math.floor(Math.random() * 10 * 1000)); // Randomize between 1 and 10 seconds
}());
The loop at the bottom is an IIFE (immediately invoked function expression), which we'll need for randomizing the time of the interval, so all of our data is created at different times rather than all at the same interval.
Go ahead and open Forge in a browser window, and run the script like so (press Ctrl+C to stop):
node eventJobQueueGenerator.jsYou'll notice that at random times, a new record is created in the queue, all with different data. Oh yes. Want a ton of data? Just loop it on the tick, and you'll have a ton of sample event data generated. Neato.
Parse events from Firebase to Keen.io
Let's now create a new file called eventJobQueueWorker.js containing the following.
var Firebase = require('firebase'),
    Keen = require('keen.io'),
    WorkQueue = require('./workqueue-advanced.js'),
    eventJobQueueRef = new Firebase('https://YOUR-INSTANCE.firebaseio.com/keen/event-job-queue'),
    keenClient = Keen.configure({
        projectId: 'YOUR-PROJECT-ID',
        writeKey: 'YOUR-WRITE-KEY'
    });

function processQueue(data, whenFinished) {
    var eventName = data.eventName;

    data.keen = {timestamp: new Date(data.createdAt).toISOString()};

    // Remove data we don't want in Keen.io
    delete data.createdAt;
    delete data.eventName;
    delete data.status;
    delete data.statusChanged;

    keenClient.addEvent(eventName, data, function(err) {
        if (err) console.log('Error adding event to Keen.io', err);

        console.log('Event data record added to Keen.io')

        whenFinished();
    });
}

new WorkQueue(eventJobQueueRef, processQueue);

console.log('Listening for event data...');
You can retrieve both the projectId and writeKey from your Keen.io web console. This file will listen for any data posted to keen/event-job-queue on your Firebase instance, immediately pick them up, post the data into Keen.io, and delete the event-job-queue record on success. Note how we are deleting the data we don't want passed into keen that we are storing in Firebase, and we're converting the Firebase createdAt data into an ISO-8601 date format so we can store it as the keen.timestamp value, which will tell Keen.io when exactly our event occurred.
Let's kick it off to see it in action:
node eventJobQueueWorker.jsThis script running should now parse through the queue, inserting everything into Keen.io.
At this point, we can now confirm that our posting Purchase event data to Firebase is successful, as is our worker listening and processing queue items to Keen.io as soon as they are posted. Note that no posting is ever done directly to Keen.io from the client, but rather to Firebase, as it is faster and we can guarantee all queue items will eventually process. This will help prevent your event data from being lost in the event you ever lose connectivity to Keen.io, your server reboots, your script crashes, etc.
Go ahead and log into the Keen.io web console, click on your project name, and under the Event Explorer, you should see Purchases listed as a possible event collection. Select it, and click Last 10 Events. You should now see your event data here, and you can inspect the records to make sure things posted successfully.
Create a Keen.io cache in Firebase
At this point, we need to setup another NodeJS worker which will call Keen.io for data analysis and store it back into Firebase. Since our client script will never call Keen.io and only call Firebase, that analytic data needs to be cached/stored in Firebase. We can call Keen.io's event data up to 1,000 times a minute, which is a good thing if we have a lot of events or data to monitor.
Create a new file called keenCacheWorker.js containing:
var Firebase = require('firebase'),
    Keen = require('keen.io'),
    cacheRef = new Firebase('https://YOUR-INSTANCE.firebaseio.com/keen/cache'),
    client = Keen.configure({
        projectId: 'YOUR-PROJECT-ID',
        readKey: 'YOUR-READ-KEY'
    }),
    checkInterval = 5000, // get new data from Keen.io every 5 seconds
    dataDelay = 20000, // allow 20 seconds of delay for data to start showing from Keen.io
    checkKeen = function() {
        var dateNow = new Date(),
            startDate = new Date(dateNow.getTime() - dataDelay),
            endDate = new Date(dateNow.getTime() - dataDelay + checkInterval),
            avgCostByGender = new Keen.Query('average', {
                eventCollection: 'Purchases',
                targetProperty: 'cost',
                groupBy: 'customer.gender',
                filters: [
                    {
                        property_name: 'keen.timestamp',
                        operator: 'gte',
                        property_value: startDate.toISOString()
                    },
                    {
                        property_name: 'keen.timestamp',
                        operator: 'lt',
                        property_value: endDate.toISOString()
                    }
                ]
            });

        client.run(avgCostByGender, function(err, res) {
            if (err) {
                console.log('error:', err);
                return;
            }

            cacheRef.child('avgCostByGender').push({
                payload: JSON.stringify(res),
                timestamp: parseInt(startDate.getTime() / 1000)
            });
        });

    };

checkKeen();

setInterval(checkKeen, checkInterval);
This script will check Keen.io every five seconds (define it faster or slower based on your event needs), and store the response from Keen.io back into your Firebase. A few notes and gotchas here: Data is usually available in Keen.io within ten seconds after inserting, however there are times where it takes a bit longer to start showing in Keen.io. I defined 20 seconds here which is typically enough time for the data to show, however feel free to modify this longer if need-be. The data we will be analyzing is purchase cost over time by gender - which is best displayed in a line graph. Because linear data needs to be chunked into a time series, we'll group the data intervals into periods of five seconds. Typically you will want to group this under a larger interval, but a smaller interval demo'd the streaming nature of this post better. We've added a start and end date for our time intervals, which we will group our data into these intervals so we have data aggregated to show on our chart.
Because Keen.io stores object names with period's, they don't store well in Firebase as they don't allow periods in key names. So we'll just stringify the payload, then parse it back into a JSON object when we call the data back from our dashboard. Now, we have a backend worker running which calls Firebase and keeps the latest response in Firebase. Cool, eh? Pretty neat for not a whole lot of work.
Run it like so:
node keenCacheWorker.jsYou should start to see data from Keen.io populate into Firebase. Note, that you may have to have your job queue worker and generator running so you can see actual results coming back.
Visualize your data
There's one piece that's left: our dashboard. Keen.io has some great-looking data visualizations and charts, but unfortunately they don't handle streaming/real-time information, so we'll have to use something else. Time-series line data isn't the easiest item to setup for a visualization demo, but I thought it was cool, so I went ahead with it.
I knew I wanted to use D3.js for charts, however there is some learning overhead involved and I didn't want to get into that in this post as it's a bit off-topic. I found Epoch Charts, which offers some real-time charting capabilities that are based on D3.js. It's a very basic charting mechanism with not a lot of bells and whistles, but it was fairly easy to get setup and hit the ground running. Their real-time line chart looked pretty close to what I was going for, so I moved forward with this script.
First we'll have to create an index.html to house our HTML:
<html>

<head>
    <title>Firebase & Keen.io Real-Time Dashboard</title>
    <link rel="stylesheet" href="css/epoch.min.css"/>
    <link rel="stylesheet" href="css/styles.css"/>
</head>

<body>

<h1>Dashboard</h1>

<h2>Average Cost By Gender</h2>

<div id="avgCostByGender" class="epoch category10"></div>
<div class="key">
    <div class="female">Female</div>
    <div class="male">Male</div>
</div>

<script src="js/jquery-2.1.3.min.js"></script>
<script src="js/firebase.js"></script>
<script src="js/d3.v3.min.js"></script>
<script src="js/epoch.min.js"></script>
<script src="js/dashboard.js"></script>

</body>

</html>
Note that we'll need to setup a few things here. Create css and js folders:
mkdir css jsAnd get the necessary scripts, moving them into their appropriate folders:
-
Epoch JS & CSS: http://fastly.github.io/epoch/download/epoch.0.6.0.zip
-
Firebase: https://cdn.firebase.com/js/client/2.2.1/firebase.js
-
D3: https://raw.githubusercontent.com/mbostock/d3/master/d3.min.js
NOTE: The Epoch javascript charting script doesn't have the ability to configure the animation speed, so I had to manually update that script to get data streaming at a good rate which aligns with how often I'm updating the data across the time span. Open up epoch.min.js, and search for this line:
setInterval(this.animationCallback,1E3Change it to the following:
setInterval(this.animationCallback,6E3This will change the stream updating every second to instead update every six seconds, which is a nice slower pace which aligns pretty well with the rate our new data is coming in.
We'll create our styles.css file, which has some very basic styling:
body {
    font-family: Helvetica, "Helvetica Neue", Arial, sans-serif;
}

h1,
h2 {
    text-align: center;
}

#avgCostByGender {
    margin: 0 auto;
    width: 960px;
    height: 320px;
}

.key {
    width: 480px;
    margin: 0 auto;
    padding: 20px;
}

.female {
    color: #ff7f0e;
    float: left;
}

.male {
    color: #1f77b4;
    float: right;
}
And our dashboard.js file:
var cacheRef = new Firebase('https://YOUR-INSTANCE.firebaseio.com/keen/cache'),
    recordLimit = 100, // 5 minutes of records
    avgCostByGender;

// We'll get up to the initial data so we can prime the chart with some history data
cacheRef.child('avgCostByGender').limitToLast(recordLimit).once('value', function(snapshot) {
    var historyDataValues = [],
        historyData = [{label: 'Female', values: []}, {label: 'Male', values: []}];

    snapshot.forEach(function(childSnapshot) {
        var data = childSnapshot.val(),
            payload = JSON.parse(data.payload);

        // Build the full dataset after getting data from Firebase
        historyDataValues.push(getResultArray(payload.result, data.timestamp));
    });

    // Let's get all of the existing data, except the records we need to delay, and build it into an array
    for (var i = 0; i < historyDataValues.length - 1; i++) {
        historyData[0]['values'].push(historyDataValues[i][0]);
        historyData[1]['values'].push(historyDataValues[i][1]);
    }

    // Let's create the chart
    avgCostByGender = $('#avgCostByGender').epoch({
        type: 'time.line',
        data: historyData,
        axes: ['top', 'right', 'button', 'left'],
        tickets: {time: 200},
        ticks: {time: 9},
        fps: 60
    });

    // We need at least two Keen.io responses to kick things off, one to prime history and one to kick off poller
    if (historyDataValues.length > 1) startPoller();
});

function startPoller() {
    cacheRef.child('avgCostByGender').limitToLast(1).on('child_added', function(snapshot) {
        var data = snapshot.val(),
            payload = JSON.parse(data.payload);

        avgCostByGender.push(getResultArray(payload.result, data.timestamp));
    });
}

// We need this to populate y & time if there is no data for that axis as we need values for both
function getResultArray(result, timestamp) {
    var newData = [],
        female = false,
        male = false;

    for (var i = 0; i < result.length; i++) {
        female = result[i]['customer.gender'] == 'Female';
        male = result[i]['customer.gender'] == 'Male';

        newData.push({time: timestamp, y: result[i]['result']});
    }

    // Populate data array with null values for time if they don't exist for that index
    if (!result.length) {
        newData.push({time: timestamp, y: 0}, {time: timestamp, y: 0});
    } else if (result.length == 1) {
        if (male) {
            newData.push({time: timestamp, y: 0});
        } else if (female) {
            newData.unshift({time: timestamp, y: 0});
        }
    }

    return newData;
}
The dashboard.js file is where all the magic happens, and where I have some explaining to do.
cacheRef.child('avgCostByGender').limitToLast(recordLimit).once('value', function(snapshot) {This line will look at our last 100 records, which is just about 5 minutes of data. Our line chart will visualize data over roughly the last 5 minutes or so, and 100 records is enough to prime the initial data history for our chart. The 'once' function ensures this will only happen once (for our initial data prime).
    var historyDataValues = [],
        historyData = [{label: 'Female', values: []}, {label: 'Male', values: []}];

    snapshot.forEach(function(childSnapshot) {
        var data = childSnapshot.val(),
            payload = JSON.parse(data.payload);

        // Build the full dataset after getting data from Firebase
        historyDataValues.push(getResultArray(payload.result, data.timestamp));
    });
Here, we are looping through our Firebase data and defining the format to use for our line charts. Note that since we are grouping our data analysis results by gender, we will define our two lines (Female, Male). We'll then loop through the data references for each child and push this data onto a data array.
Note that we are calling the getResultArray function:
// We need this to populate y & time if there is no data for that axis as we need values for both
function getResultArray(result, timestamp) {
    var newData = [],
        female = false,
        male = false;

    for (var i = 0; i < result.length; i++) {
        female = result[i]['customer.gender'] == 'Female';
        male = result[i]['customer.gender'] == 'Male';

        newData.push({time: timestamp, y: result[i]['result']});
    }

    // Populate data array with null values for time if they don't exist for that index
    if (!result.length) {
        newData.push({time: timestamp, y: 0}, {time: timestamp, y: 0});
    } else if (result.length == 1) {
        if (male) {
            newData.push({time: timestamp, y: 0});
        } else if (female) {
            newData.unshift({time: timestamp, y: 0});
        }
    }

    return newData;
}
This is a sort of helper function that is used to massage the data into the format we need. For the line chart, data values must exist for both groupings (Female and Male), so if the result is non-existent for one gender, we must backfill the data in which zero data. Note that the timestamps need to match on each time interval grouping, otherwise charty is no worky. In the event that no results exist at all for either gender, we will prime this data with the timestamp and zero-values for each gender.
    // Let's get all of the existing data, except the records we need to delay, and build it into an array
    for (var i = 0; i < historyDataValues.length - 1; i++) {
        historyData[0]['values'].push(historyDataValues[i][0]);
        historyData[1]['values'].push(historyDataValues[i][1]);
    }

    // Let's create the chart
    avgCostByGender = $('#avgCostByGender').epoch({
        type: 'time.line',
        data: historyData,
        axes: ['top', 'right', 'button', 'left'],
        tickets: {time: 200},
        ticks: {time: 9},
        fps: 60
    });

    // We need at least two Keen.io responses to kick things off, one to prime history and one to kick off poller
    if (historyDataValues.length > 1) startPoller();
This next section of code then loops through all of that cleansed data, and pushed it onto a historyData array, which we will then pass onto our chart for priming it's initial history. Note the for loop: we are looking at all values except the last value here; subtracting one from historyDataValues.length ensures we skip over the last record. Why do we want to do this? Because the last record will be used to kick off the poller, so we can start streaming and animating the incoming data. We also won't start the poller unless there are at least two records in keen/cache/avgCostByGender because of this.
function startPoller() {
    cacheRef.child('avgCostByGender').limitToLast(1).on('child_added', function(snapshot) {
        var data = snapshot.val(),
            payload = JSON.parse(data.payload);

        avgCostByGender.push(getResultArray(payload.result, data.timestamp));
    });
}
This last section listens to anything added to the avgCostByGender cache, and pushes the data onto our chart. Note that we limited it to the last record, so the first time it runs, it will fetch the last record we skipped when we primed the initial history data for our chart. This initial push starts our chart streaming, and every subsequent record added to the avgCostByGender cache keeps the chart moving with the updated data.
Test out the real-time stream
Our final step is to kick everything off in order.
Let's start our event job queue worker:
node workers/eventJobQueueWorker.jsNow we'll start creating some events:
node workers/eventJobQueueGenerator.jsWe'll start streaming data from Keen.io back into Firebase:
node workers/keenCacheWorker.jsThen once we have a couple keen cache records, we'll fire up our dashboard:
open index.htmlAnd there you have it!

A real-time streaming dashboard using Firebase as a proxy cache for Keen.io. When new data comes in, it'll stream right to your dashboard without the need for refreshing the page or directly calling Keen.io. This makes creating white-label real-time dashboards with advanced analytics a possibility, without having to manage any backend service.
All of the code in this tutorial is available on github at https://github.com/markoshust/firebase-keen
This post originally ran on airpair.com, which has since shut down. I've restored it here from the Internet Archive. The code is on GitHub at markoshust/firebase-keen.